Doublet Detection on 10k PBMCs from 10x Genomics v3#
[1]:
import numpy as np
import doubletdetection
import scanpy as sc
import matplotlib.pyplot as plt

sc.settings.n_jobs=8
sc.set_figure_params()
Download Data from 10x#
Load Count Matrix#
[2]:
adata = sc.read_10x_h5(
    "pbmc_10k_v3_filtered_feature_bc_matrix.h5",
    backup_url="https://cf.10xgenomics.com/samples/cell-exp/3.0.0/pbmc_10k_v3/pbmc_10k_v3_filtered_feature_bc_matrix.h5"
)
adata.var_names_make_unique()
Variable names are not unique. To make them unique, call `.var_names_make_unique`.
Variable names are not unique. To make them unique, call `.var_names_make_unique`.
[3]:
# remove "empty" genes
sc.pp.filter_genes(adata, min_cells=1)
Run Doublet Detection#
Here we show-off the new backend implementation that uses scanpy. This new implementation is over 2x faster than version 2.4.0. To use the previous version of DoubletDetection please add the parameters (clustering_algorithm="phenograph", verbose=True, standard_scaling=False) to the classifier and use the thresholds p_thresh=1e-7, voter_thresh=0.8. We recommend first using these parameters until we further validate the new implementation.
We support the following clustering algorithms:
phenograph
louvain
leiden
The latter two use the scanpy implementations.
[4]:
clf = doubletdetection.BoostClassifier(
    n_iters=10,
    clustering_algorithm="louvain",
    standard_scaling=True,
    n_jobs=-1,
)
doublets = clf.fit(adata.X).predict(p_thresh=1e-16, voter_thresh=0.5)
doublet_score = clf.doublet_score()
100%|██████████| 10/10 [02:03<00:00, 12.36s/it]
[5]:
adata.obs["doublet"] = doublets
adata.obs["doublet_score"] = doublet_score
Visualize Results#
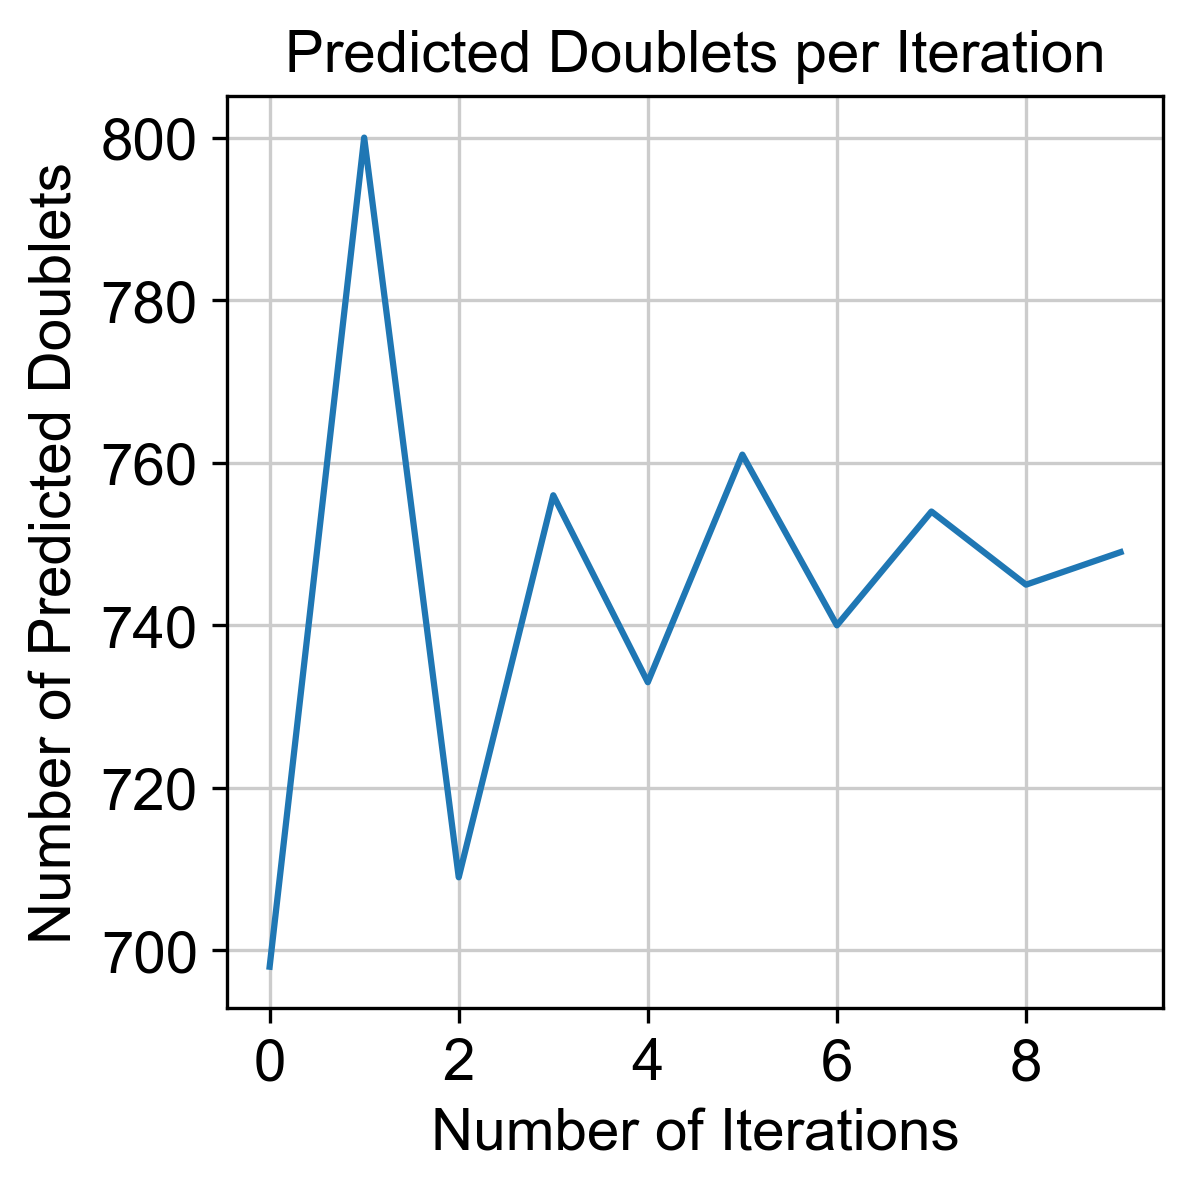
Convergence of doublet calls#
[6]:
f = doubletdetection.plot.convergence(clf, save='convergence_test.pdf', show=True, p_thresh=1e-16, voter_thresh=0.5)
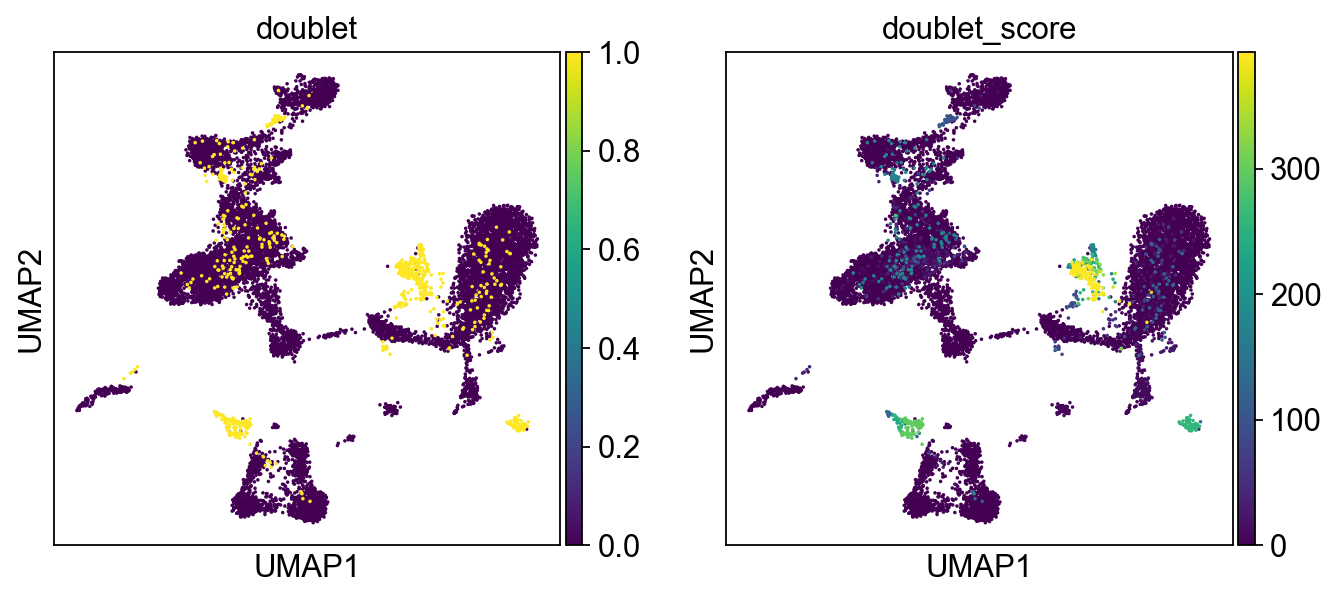
Doublets on umap#
[7]:
sc.pp.normalize_total(adata)
sc.pp.log1p(adata)
sc.pp.highly_variable_genes(adata)
sc.tl.pca(adata)
sc.pp.neighbors(adata)
sc.tl.umap(adata)
[8]:
sc.pl.umap(adata, color=["doublet", "doublet_score"])
... storing 'feature_types' as categorical
... storing 'genome' as categorical
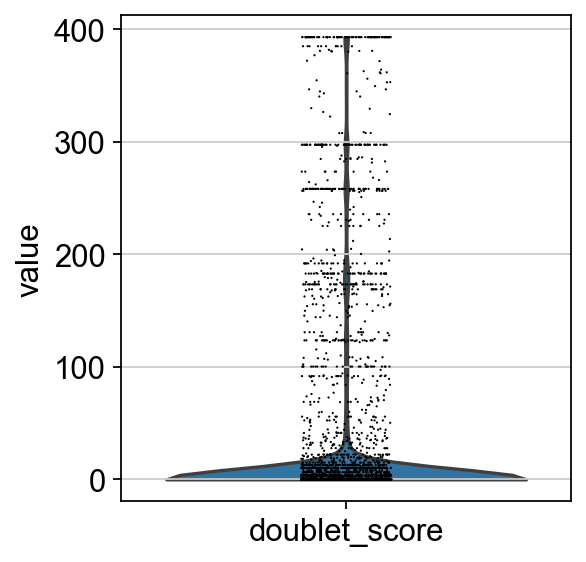
[9]:
sc.pl.violin(adata, "doublet_score")
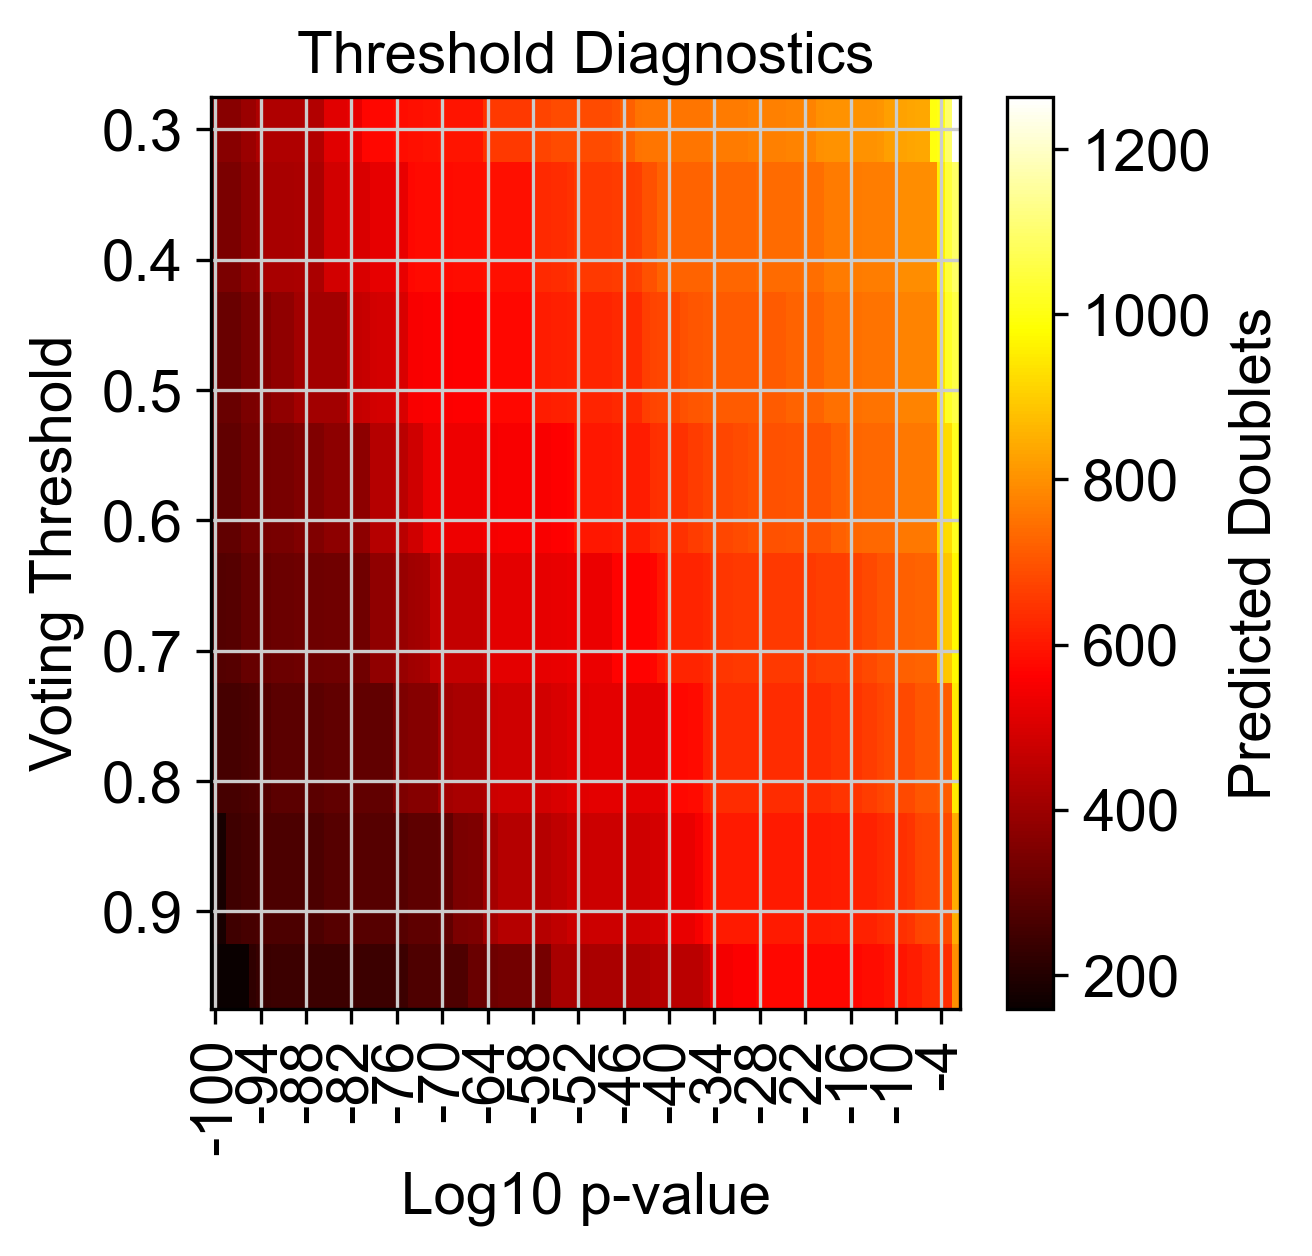
Number of predicted doublets at different threshold combinations#
[10]:
f3 = doubletdetection.plot.threshold(clf, save='threshold_test.pdf', show=True, p_step=6)